FOMO (Fear Of Missing Out) has modestly crept back into the market narrative. The irony is that sidelined cash may keep a relative floor on how far markets correct. Do one fun activity with family and friends – ask who’s waiting to buy an equity market selloff. Follow it up with “At what level?”. Our sense is that most people will say 5%-10% lower. It’s always 5%-10% lower. Range-bound is likely the right way to describe current markets. We’ve been trading the same broad ranges on the BSE500 for most of this calendar year. Sidelined cash may not let us re-test last October’s low unless something really goes wrong. While Mr. Market will continue to be a mystery, throwing nasty surprises time and again, let us map the possible scenarios for Mr. Market from a longer-term horizon.
India’s Footing
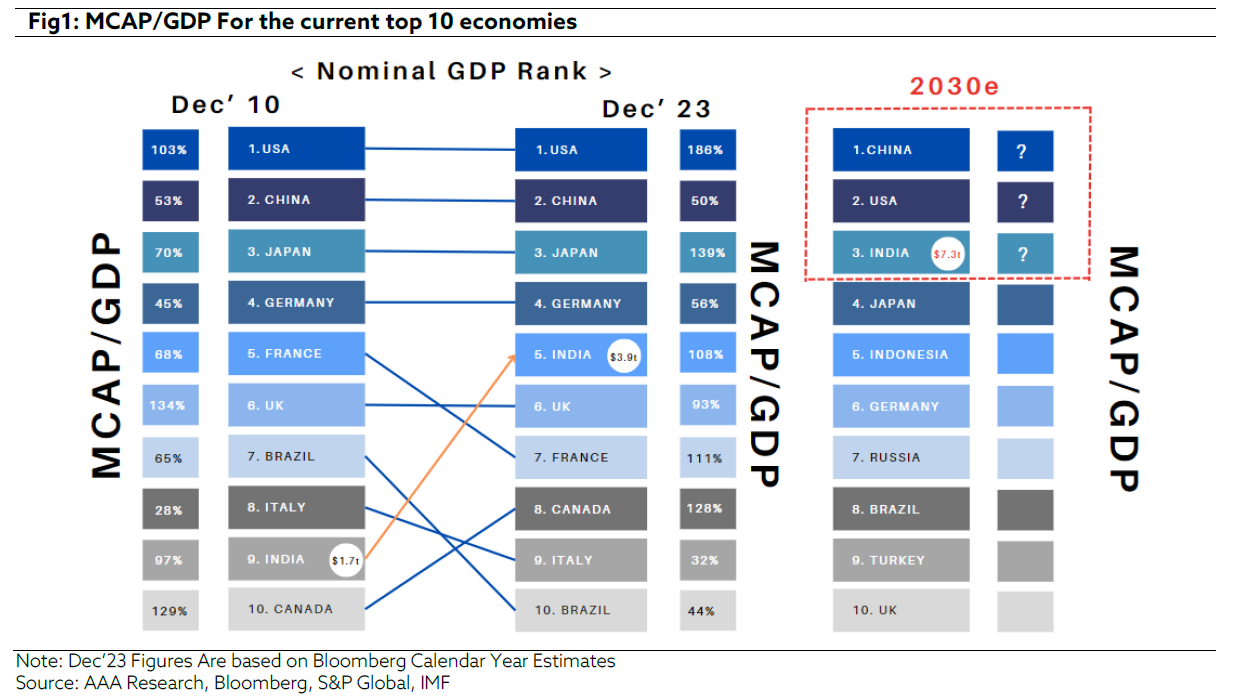
Looking at the transition of the current developed nations, it is interesting to observe how the GDP growth influences the Market Cap Growth. For instance, in the recent decades, USA GDP growth has become relatively stable, hovering around 2-3% annually as compared to the 80s and 90s where the economy underwent a massive expansion. Despite the reversion of this growth to normal levels, it is quite surprising to know the USA Market Cap to GDP has continued to increase, standing at a staggering 186% right now, as compared to 103% thirteen years ago.
However, in India, the pattern is strikingly different. India’s MCAP/GDP has remained relatively stable, going from 97% to 108% over the same period. On the other hand, the Indian economy has continued to skyrocket, with India now standing as the 5th largest economy in the world. Hence, there is a significant disparity between the two figures. While we understand that there are a multitude of factors influencing this ratio, we believe that India’s MCAP/GDP ratio can have a multiplier effect going forward. Considering the $7.3 trillion-dollar economic target by 2030, India is poised to become at least the third largest economy in the world. If this is true, then the Indian markets can multi-fold over this decade, as markets are always forward looking in nature.

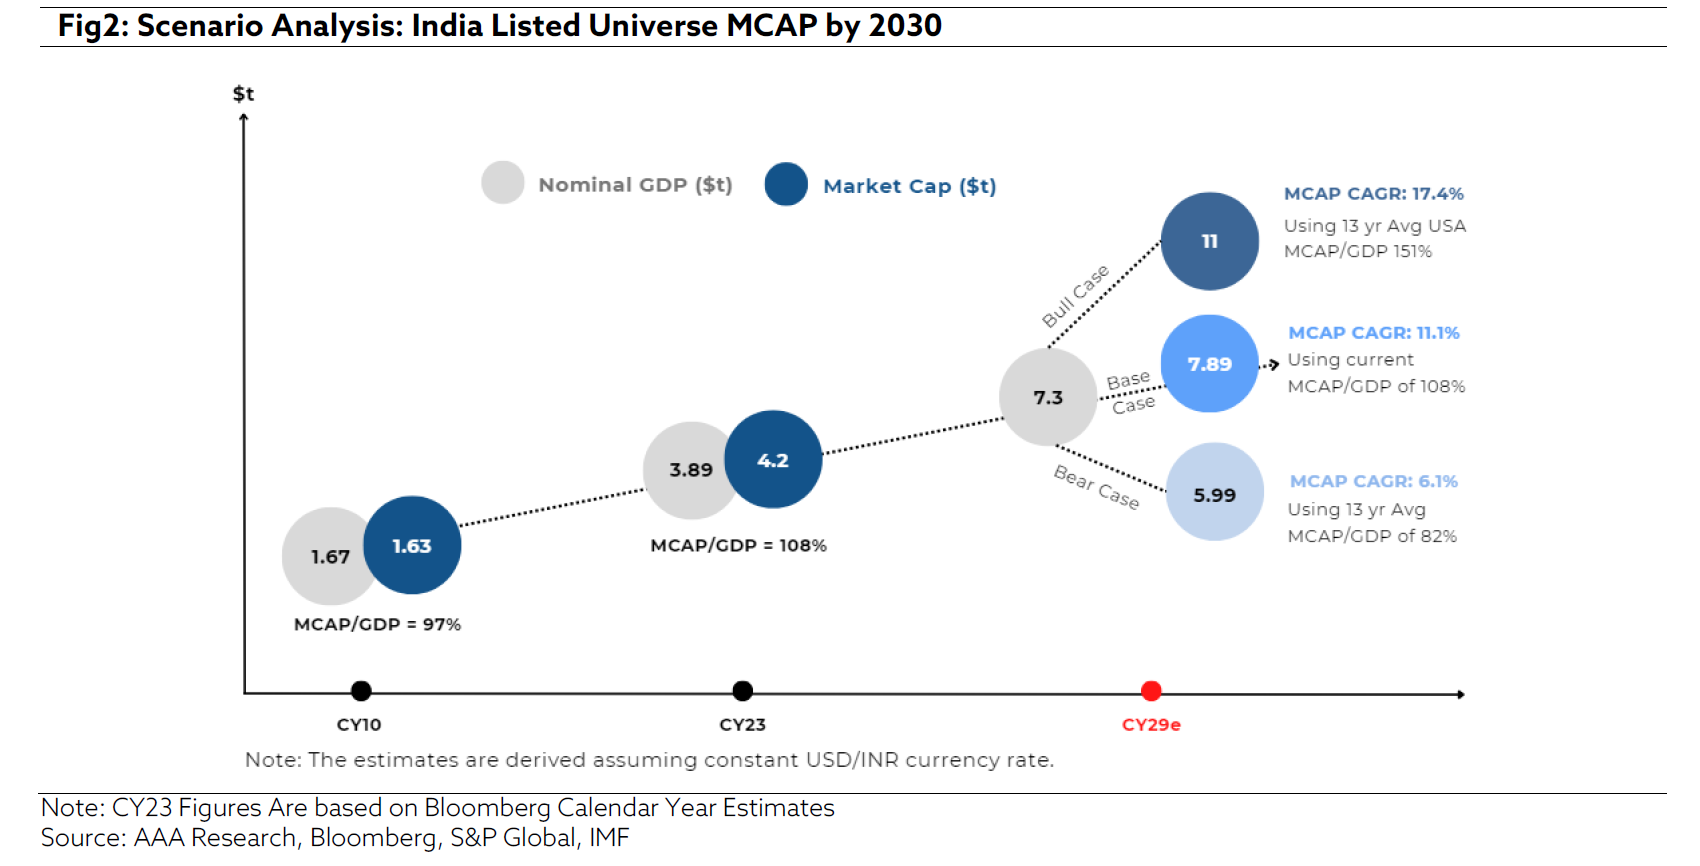
Taking a step further, we tried to arrive at the possible Market Cap of the listed universe in India before 2030 (Ref Fig2). In our base case, assuming that India enjoys the same MCAP/GDP in 2029 as it is currently, the MCAP CAGR turns out to be 11.1% for CY24-CY29. In a bullish scenario, assuming India can trade at a similar MCAP/GDP ratio as
USA, and calculating backwards, it can be deduced that the listed universe in India can deliver 17.4% CAGR over the next six years. Lastly, on the downside, we assume India’s MCAP/GDP to be in line with the previous average of 82%, which still results in an annualized return of 6.1% over the same period. It is important to note that all figures are in USD and hence currency depreciation has not been accounted for.
All in all, India continues to stand on a strong footing, and as some forecast, it has the potential to be the breakout market of this decade. Our previous market stance continues: Be Bullish, Be Prudent. We acknowledge that there are pockets of the market where valuations are running ahead of their fundamentals. However, at a broader level, markets seem to be trading at reasonable valuations.

Quarterly Earnings Update
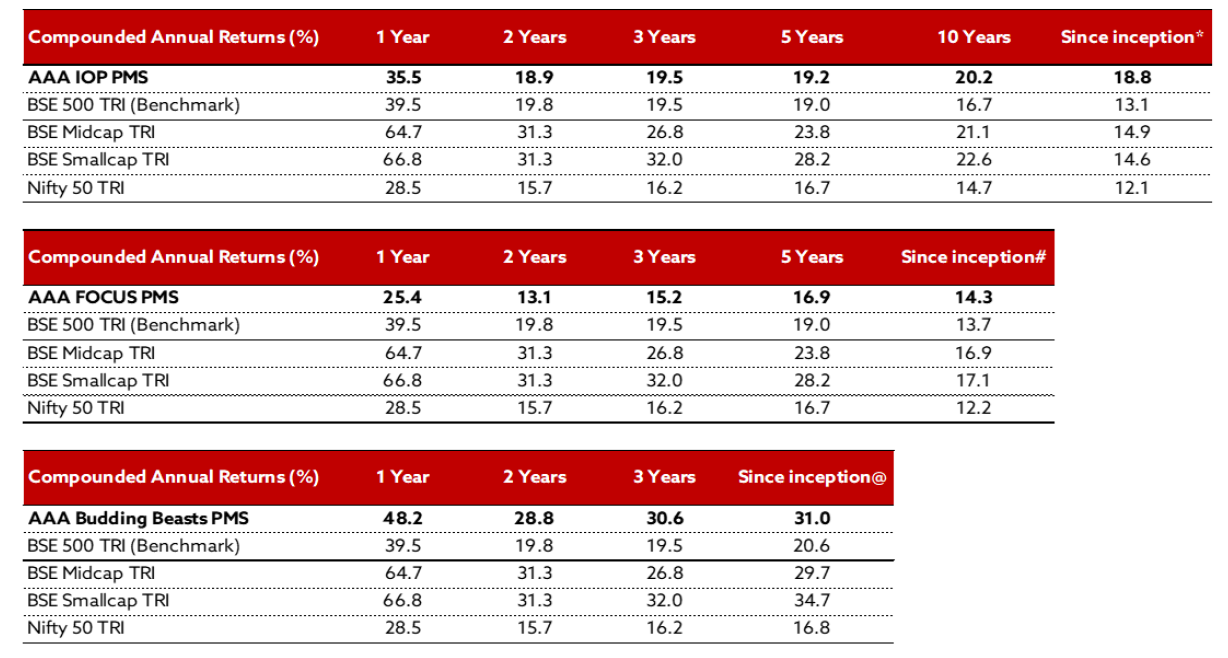
For 3QFY24, our portfolio strategies delivered a strong performance as compared to Nifty (Ref Fig 3,4,5). In terms of sectoral analysis, sectors like auto, cement and healthcare registered good volume growth as well as improvement in margins due to lower raw material/freight costs. The Capital Goods sector continued to register strong growth in order intake with key sectors like power, T&D, renewable energy, data centers, real estate, and defence witnessing strong traction. The sectors which remain under pressure are FMCG, Chemicals, and Information Technology. The banking sector posted a mixed performance in 3QFY24, marked by healthy business growth, controlled provisions, persistent NIM pressure, and high operating expenditure.

AAA PMS Performance

*(23 Nov 2009 – 29 Feb 2024); #(17 Nov 2014 – 29 Feb 2024); @(01 Jan 2021 – 29 Feb 2024)
Performance is after all expenses and fees from April 2018 onwards. Prior to April 2018, the performance is after all expenses and Fixed Management fees. Index performance is calculated using Total Return Indices, as per SEBI guidelines.
Note: Returns of Individual clients may differ depending on the time of entry in the strategy. Past performance may or may not be sustained in the future and should not be used as a basis for comparison with other investments. Performance related information provided herein is not verified by SEBI.
DISCLAIMER: This document is not for public distribution and has been furnished to you solely for your information and may not be reproduced or redistributed to any other person. The manner of circulation and distribution of this document may be restricted by law or regulation in certain countries, including the United States. Persons into whose possession this document may come are required to inform themselves of, and to observe, such restrictions. This material is for the personal information of the authorized recipient, and we are not soliciting any action based upon it. This report is not to be construed as an offer to sell or the solicitation of an offer to buy any security in any jurisdiction where such an offer or solicitation would be illegal. No person associated with AlfAccurate Advisors Pvt Ltd is obligated to call or initiate contact with you for the purposes of elaborating or following up on the information contained in this document. The material is based upon information that we consider reliable, but we do not represent that it is accurate or complete, and it should not be relied upon. Neither AlfAccurate Advisors Pvt Ltd., nor any person connected with it, accepts any liability arising from the use of this document. The recipient of this material should rely on their own investigations and take their own professional advice. Opinions expressed are our current opinions as of the date appearing on this material only. While we endeavour to update on a reasonable basis the information discussed in this material, there may be regulatory, compliance, or other reasons that prevent us from doing so. Prospective investors and others are cautioned that any forward-looking statements are not predictions and may be subject to change without notice. We and our affiliates, officers, directors, and employees worldwide, including persons involved in the preparation or issuance of this material may; (a) from time to time, have long or short positions in, and buy or sell the securities thereof, of company (is) mentioned herein or (b) be engaged in any other transaction involving such securities and earn brokerage or other compensation or act as a market maker in the financial instruments of the company (is) discussed herein or may perform or seek to perform investment banking services for such company(is)or act as advisor or lender / borrower to such company(is) or have other potential conflict of interest with respect to any recommendation and related information and opinions. The same persons may have acted upon the information contained here. No part of this material may be duplicated in any form and/or redistributed without AlfAccurate Advisors Pvt Ltd.’s prior written consent. No part of this document may be distributed in Canada or used by private customers in the United Kingdom. In so far as this report includes current or historical information, it is believed to be reliable, although its accuracy and completeness cannot be guaranteed.


